Nestegg Cycle © Concepts and Examples:
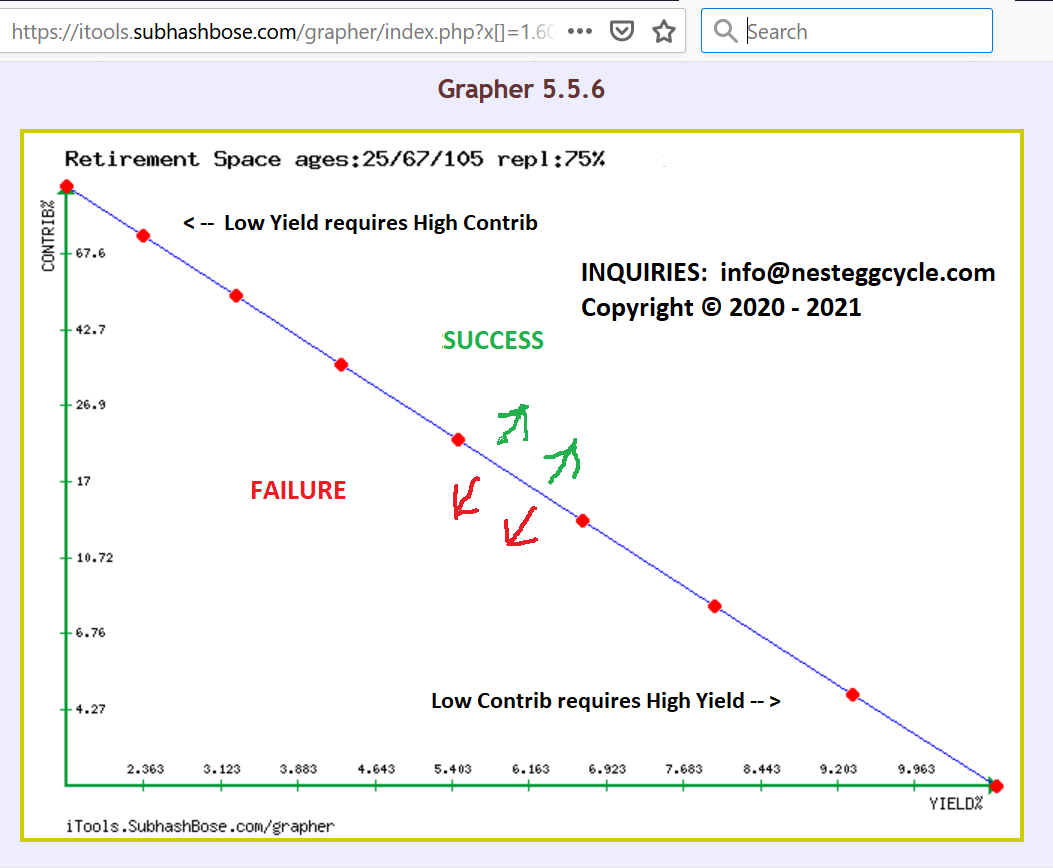
The Contribution _versus_ Required Yield Trade-off Curve
Key concept at this site:
Each retirement saver's situation, including yours, has NOT ONE solution, but a whole RANGE of PAIRED solutions which fall along a tradeoff curve.
We provide this custom plotted curve, as well as a choice of reports of pre-selected contribution amounts along this curve,
and the investment yield required to make each contribution amount lead to a successful retirement outcome for your situation,
which will include a salary replacement percentage goal you will set, 75% by default.
WHY THIS MATTERS TO YOU:
Consider our default case of a 25-year-old worker, expecting to work until age 67,
and then to replace 75% of final salary from retirement investments.
Worker has no prior savings, expects 3% raises annually, and expects 2.5% inflation;
and needs the capacity for retirement payouts to continue until age 105.
Here is our standard report for this case:
contrib:   yield:  sav/sal: withdrw:
  2.50%   11.222%    8.42X    8.91%
  5.00%    9.404%   10.20X    7.35%
 10.00%    7.601%   12.69X    5.91%
 20.00%    5.812%   16.28X    4.61%
 40.00%    4.036%   21.61X    3.47%
 80.00%    2.268%   29.80X    2.52%

Multiplier of Salary & Prices during 42 working years:
Salary: 3.3599    Prices: 2.7522
Somewhere in this range, hopefully, you can find a "sweet spot". Other reporting options allow you to focus
your attention more closely, for instance to see yields for contributions of 10%, 11%, 12% ... 18%, 19%, 20%.
And of course you can re-run with higher or lower goals until you find something that works for you.
IF your contribution is as low as 2.5% of salary ... you need an investment yield of 11.222%, to reach the 75% replacement goal.
IF your investment yield is as low as 2.268% ... you need to contribute 80% -- YES 80% -- of salary, to reach the 75% replacement goal.
Next imagine you are invested at 2.268% but only contributing 2.5%, not 80%:
Clearly you will only accumulate 1/32-nd as much toward retirement (80/2.5 = 32)
and that means only 1/32-nd of the 75% goal, or about a 2.34% salary replacement: a disappointing, insufficient result.
Next, imagine that your 2.5% contribution is earning not 2.268%, but perhaps 1% or even 0.1% interest,
and now the salary replacement from the previous sentence, drops to a small fraction of the 2.34% !!
So the lesson is that you do need to properly pair your contribution amount, with your investment yield.
You cannot wave this off with a "Whatever!".
Thoughts About your Employer's Matching Contribution:
IF you get a company match to your retirement plan contribution,
this should be ADDED IN when reviewing contribution/yield options.
IF, at the investment yield you are getting, this software calculates that you need to contribute more than you are doing now
(including the company match) to meet your goal, you'll want to consider among:
a - Contributing more out of your own pocket, beyond what your company will match, to pair properly with your current yield;
b - Modifying your retirement investment mix to come up to the calculated yield to reach your goal with current contribution;
c - Any blend of a & b that preserves your goal;
IF none of a/b/c can be done - understand that you are NOT on track for your goal. Lower your expectations.
You are encouraged to think about whether you might want, or need, more or less retirement income than 75% of your salary.
In a frequently cited article,
Fidelity Investments®
suggests savings benchmarks based on a goal of 45%.
Read article footnotes carefully for detailed assumptions they used.
You are invited to run NesteggCycle's calculations at both 45% and 75%, or whatever works for you.
Not surprisingly, a smaller retirement payout is easier to achieve; only you can decide whether it is enough.
Every item of data on the screen, has an effect on the customized solution calculations you get.
Default values, deemed reasonable by the author, are provided for each item to help get you started,
but the more specific you can be about your own situation, the more realistic and useful your outputs will be!
SOME EXAMPLE CALCULATIONS, with Live, Interactive Plots.
Click on any link below, then watch what happens as you move the mouse pointer along the plotted blue curve.
This is the line running through the red points, which are actual solutions discovered and plotted for you.
All examples use Retirement Age 67, End Age 105, and Goal Salary Replacement of 75%
These examples were compiled in late 2020 through early 2021. For general illustration only. The algorithm has been refined since then.
You should re-run on current NesteggCycle website if you want to see exact numbers.
WATCH how INCREASING SAVINGS amounts, alter the SHAPE of the CURVE