Nestegg Cycle © RUN & GET Your RESULTS:
For background, please be sure you have read "CONCEPTS & EXAMPLES", "What this IS", "What this is NOT" and "SET YOUR GOAL".
RUN Controls:
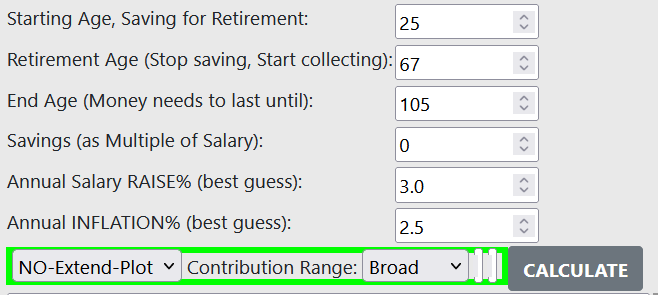
Locate the CALCULATE button under the data you've entered
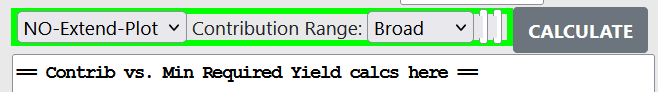
BEFORE clicking the CALCULATE button
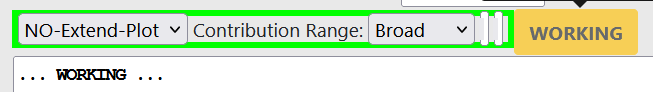
DURING the PROCESSING
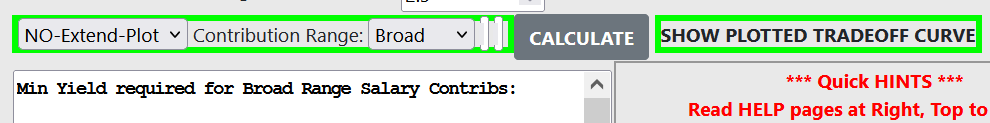
AFTER PROCESSING. Your RESULTS are AVAILABLE
There are two parts to the results.
First and directly under the CALCULATE button, is the report of
Minimum Yield required for selected Salary Contribution percentages starting at the smallest contribution in your list.
If you are taking the default report, this will be 2.5%.
These results will be described in more detail below in the section, "Understanding Your Report".
The other result is accessed by clicking on the green-bordered "SHOW PLOTTED TRADEOFF CURVE"
link which appears to the right of the CALCULATE button. The plot will then appear in a new browser tab
titled: Grapher - Best free online ...
shown here with yellow hi-lite lines added for emphasis.
This is third-party freeware we have used, from this site, https://itools.subhashbose.com/
Visit this tab to see your plotted curve. You can scroll down and see the table of exact
(Yield%, Contrib%) value pairs
discovered for you, and you can download these values.
You will always find one point where the Yield% and Contrib% values are the same.
In our default case, this point is (8.136%, 8.136%) ... for our 25-year-old with goal of 75%.
This is a handy index as to the level of difficulty of achieving the retirement goal at hand.
For the same 25-year-old with a goal of 50%, this point is (7.349%, 7.349%).
Or with a goal of 25%, this point becomes (6.058%, 6.058%).
And again, ANY and EVERY point along the blue plotted curve here, is a solution for you:
a combination of Yield% and Contrib% which will satisfy your requirements for retirement.
To SAVE your Results:
Open a file on your local computer, using your favorite text editor.
Position your cursor, click or tap, in the "Minimum Yield required for selected Salary Contributions:"
area under the CALCULATE button. Select ALL, and COPY; PASTE this into your open local file.
Next place your cursor in the address bar of the Grapher, Select ALL, and COPY.
Now bring your cursor back into your local file and, below the previous material, PASTE this,
a long URL containing all the necessary data to re-create the plot.
CLOSE your local file, and there you are.
A nice hack to keep the interactive plot handy: In the Address bar, locate the icon to left of the address.
DRAG this to your Desktop, or to any other folder you prefer. Now you have a shortcut to the interactive plot.
Understanding Your Report:
Every on-screen report begins with a top line like this, showing (in place of the "xxx") which reporting options were selected:
Min Yield required for xxx Range Salary Contribs:
Consider the reports just below, where we've abbreviated some middle rows with an ellipsis ("...")
The yellow hi-lighting is for emphasis here, and does NOT appear in your actual on-screen report header.
In the first, the POST Retirement processing is UN-checked:
1 after contrib: yield is same PRE & POST Ret
contrib:     yield:  sav/sal: withdrw:
  0.10% 1 * 12.613%    1.97X   10.15%  from MIN:  0.39%
  5.10% 1    5.927%    4.27X    4.69%
 10.10% 1    4.175%    5.63X    3.55%
 ...
 45.10% 1    0.372%   11.75X    1.70%
 50.10% 1 *  0.355%   11.79X    1.70%  from MAX: 45.39%
AND in the second, the POST Retirement processing is CHECKED and entered as 4.0%:
  1 after contrib: yield is same PRE & POST Ret
  2 after contrib: yield is PRE-ret, and 4.0% POST-ret
contrib:     yield:  sav/sal: withdrw:
  0.10% 2 * 16.305%    5.80X    3.45%  from MIN:  0.39%
  5.10% 2    7.169%    5.80X    3.45%
 10.10% 2    4.308%    5.80X    3.45%
 ...
 45.10% 1    0.372%   11.75X    1.70%
 50.10% 1 *  0.355%   11.79X    1.70%  from MAX: 45.39%
First let's look at the regular four columns of numbers.
contrib:
These are your starting points: a sampling of percentages of salary, to be contributed to the retirement plan.
There are several "canned" lists of contributions, and an option for generating customized lists.
yield:
For each contribution percentage, this is the investment yield calculated to meet your specified GOAL.
It's a tradeoff -- less contributed requires more yield to meet the goal, and vice versa.
SEE the "Concepts & Examples" page in this HELP area, for more discussion.
sav/sal:
This is the ratio of the [retirement fund balance as of the retirement date] / [final year's salary]
This is the answer to the frequently posed question, "How many years' salary have you accumulated toward retirement?".
Here, it is the number of years' salary required in savings, to meet your goal at your contribution rate,
and with the paired investment yield(s) calculated for your situation.
withdrw:
Ratio of [initial retirement year's PAYOUT] / [amount in the Retirement Acct, at start of retirement]
You may wish to compare the "withdrw" value with popular discussions of a "Safe Withdrawal Rate" for perspective,
but be aware that in NesteggCycle.com, there is NO expectation at all,
that this value will remain fixed year after year. Rather, it will increase over time, in a controlled fashion,
reaching 100% in your End Age year.
CAUTION! Your savings will be EXHAUSTED, GONE, if you survive into your specified End Age year!
Give this age some serious thought. Consider bumping it up another 5 or 10 years if in doubt, and re-run the calculation.
Rows with "1" after the Contrib (Type 1):
Yield shown is same PRE & POST Retirement (UNI-yield)
When the POST-ret box is UN-checked, all report rows will be type "1"s.
Even when the POST-ret box is CHECKED,
but the UNI-yield is LESS than the desired POST-ret yield, the Type 1 row is shown.
Prior to the version of early March 2022, ALL rows showed this calculation, and could have been called Type 1.
Rows with "2" after the Contrib (Type 2):
Yield shown is PRE-retirement only, allowing for the specified POST-retirement yield.
When the POST-ret box is CHECKED,
and the UNI-yield is greater than the desired POST-ret yield, this new calculation is done.
Be aware of the trade-off: Lower POST-ret yield will require higher PRE-retirement contributions and/or higher yield
because it will require a larger amount of savings!
Rows with Asterisk ("*") after the Contrib:
The asterisk alerts you to the fact that this contribution percentage was "out of bounds" and could not be used
to calculate a yield. Instead, the closest available contribution that COULD be used, was substituted.
This amount is shown to the right of the other numbers, after "from MIN:" or "from MAX:".
Thus, in the first row, 0.10% was requested, but 0.39% was used instead, as the MINimum available value.
Similarly, in the last row, 50.10% was requested, but 45.39% was used instead, as the MAXimum available value.
On these rows, the yield and other information, is for the SUBSTITUTED contribution%.
When this happens, there will also be a message at the bottom of the report (you may have to scroll down):
== Use "No-Extend-Plot" dropdown to help manage:
	"from MAX": select Hi-C-Extend
	"from MIN": select Lo-C-Extend
When you re-run your request with the proper "Extend" option selected, the calculator performs extra work to find solutions beyond those usually required. This will sometimes resolve the issue completely; otherwise it at least gets you closer.
Below the Columns of data, you will also see something like this:
Multiplier of Salary & Prices during 42 working years:
Salary: 3.3599    Prices: 2.7522
This shows you the effect of compounding your salary raises, and your price inflation, for the number of years you work.
The above numbers come from our default assumptions: 3% raises, 2.5% inflation, and 42 years worked (ages 25 to 67)
and will be different when you override any of them.
NOTE: This scenario was specially engineered to illustrate issues at BOTH extremes - "MIN" and "MAX".
Typically you'd see only MIN, or only MAX, if any, with an asterisk ("*") to the right of the contribution%.
IF you'd like to reproduce this scenario yourself, enter the GOAL as 20%, ages as 25, 67, and 105,
Custom Contribution Range as 25.1 by 5.0, Raise as 3.0% and Inflation as 2.5%, and POST-ret Yield as 4.0%.